


Oddly favorites: September's edition
Oddly favorites: September's edition
Our end-of-the-month favorites are here.


It is official: the end of the year is right around the corner 🫠, and there are many things to do before we can say 👋 to 2023.
This year made us realize we need to change a few things, so we have news coming your way. So don’t worry if you find our website out of reach for the next month. Something else is coming up. But more on that later. 🤫
Here are some of our team month’s favorites. I hope you enjoy them as much as we did.
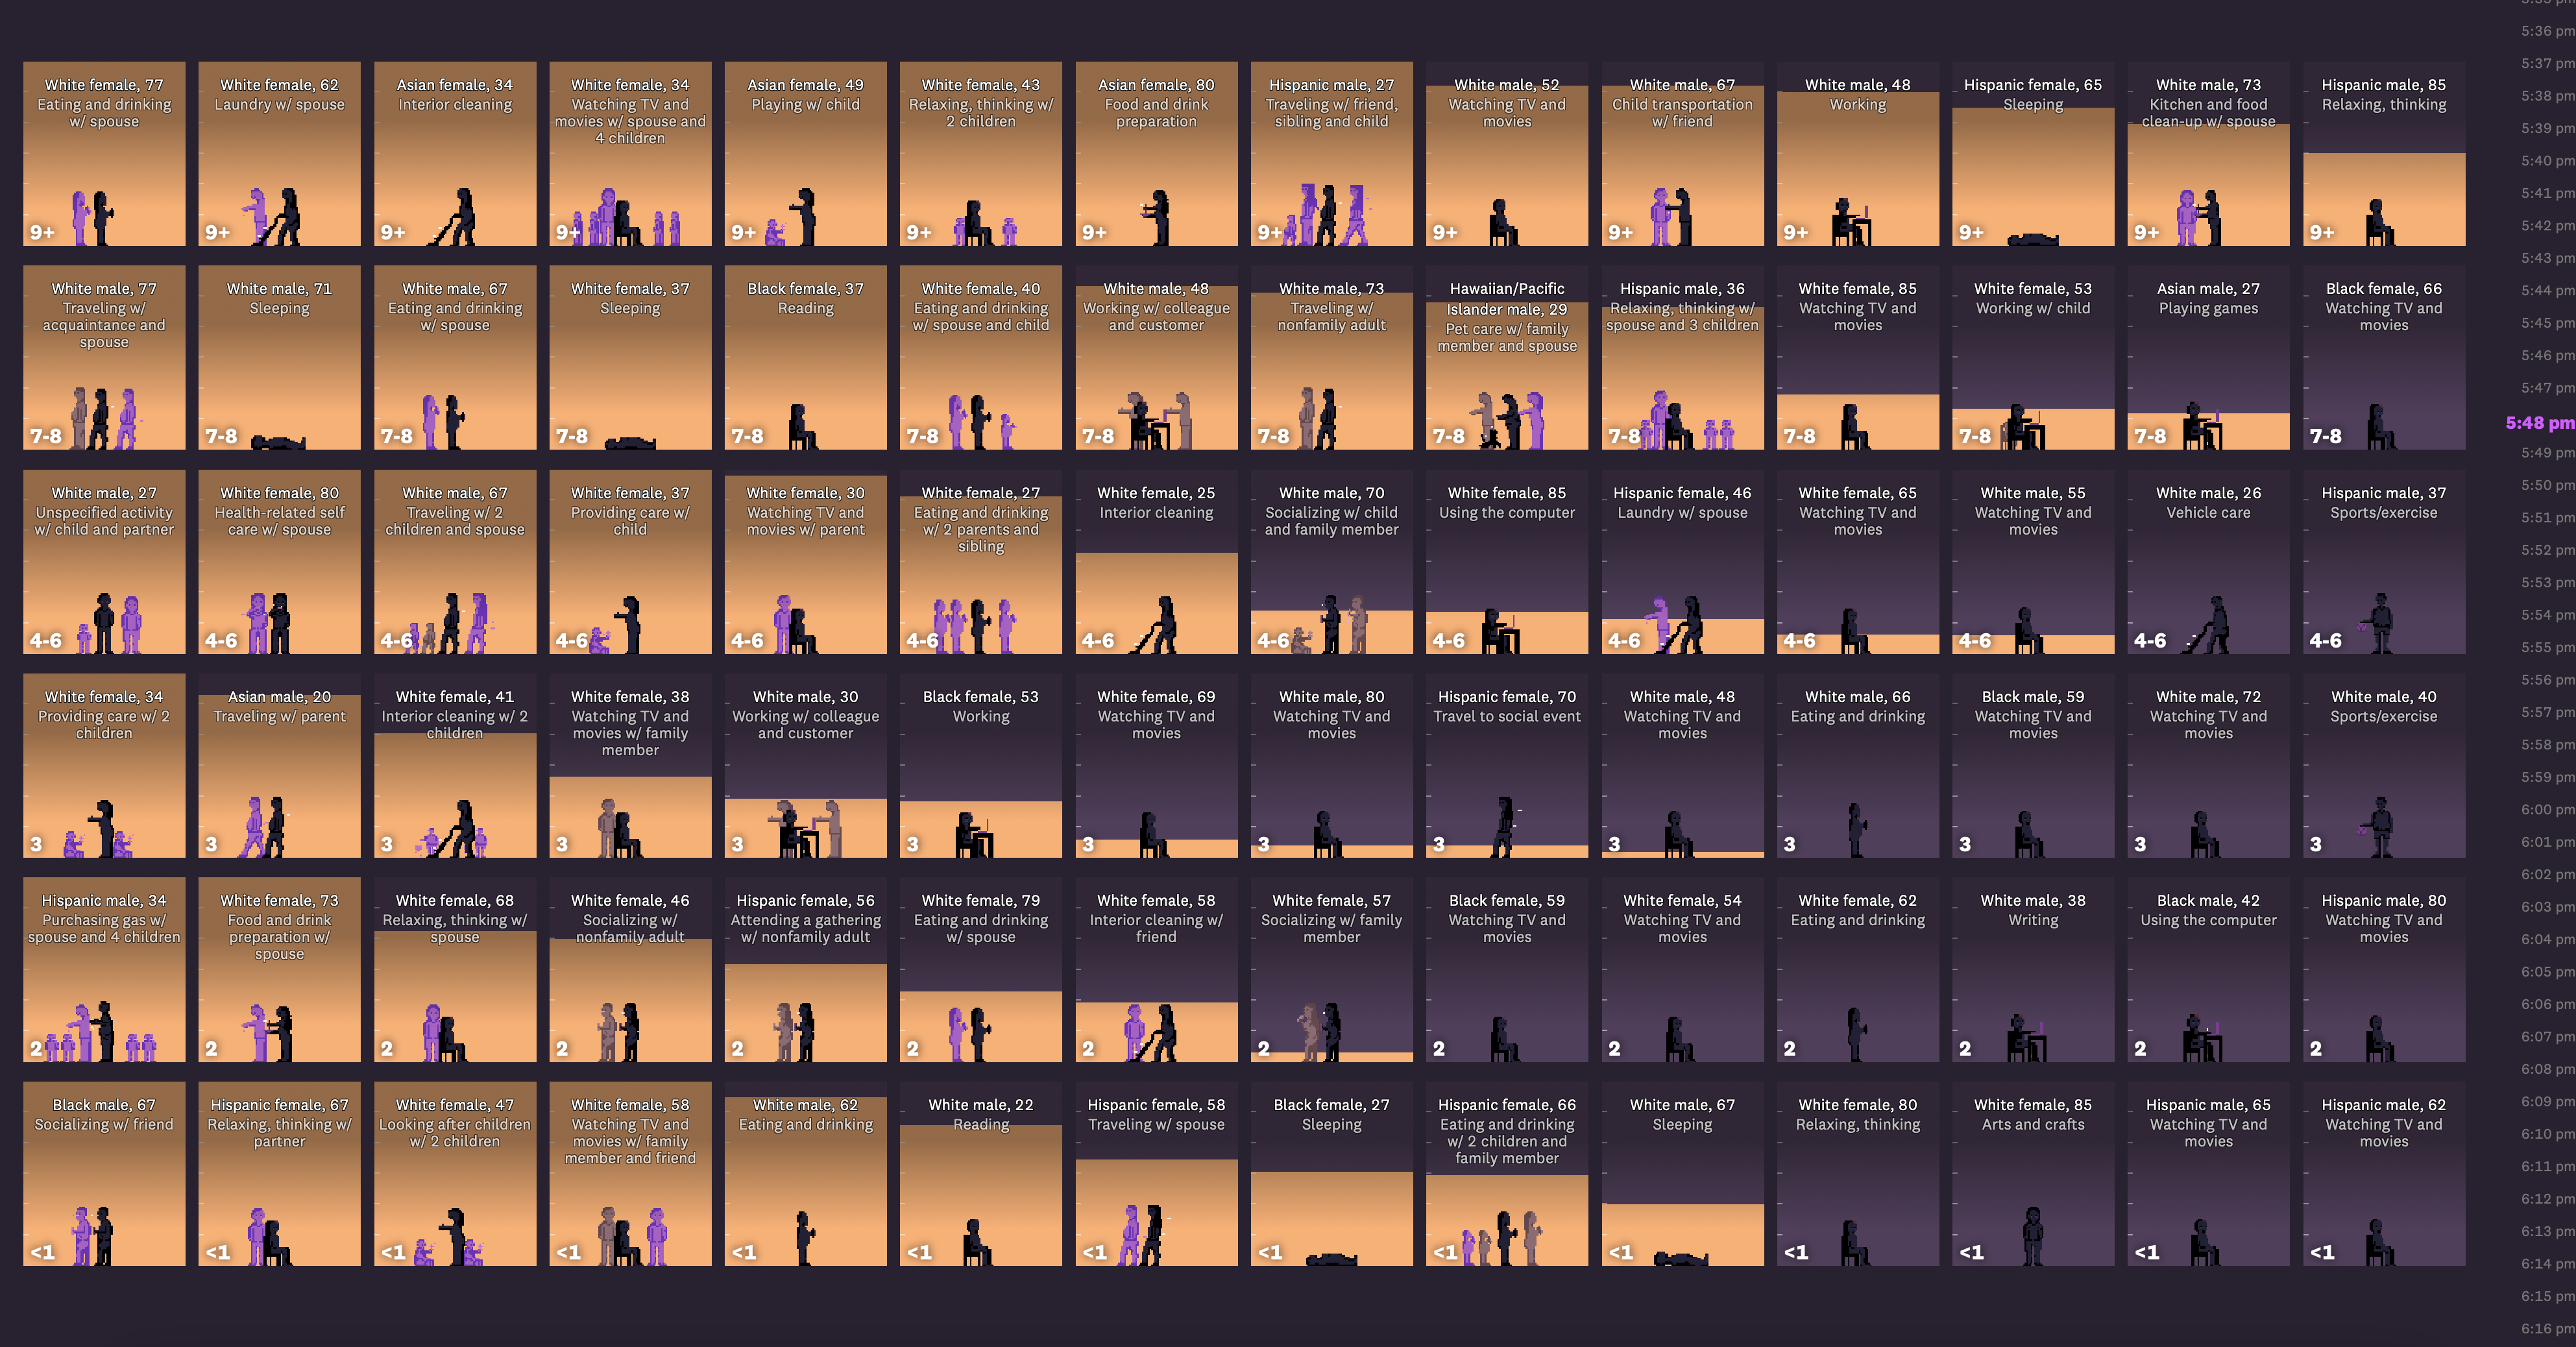
💜Sensitive interactive data storytelling: 24 hours in an invisible epidemic
Isolation is a global issue. This fantastic visualization by Alvin Chang and the Pudding looks at a typical day on the weekend during the pandemic on the lives of Americans and how much they interact daily with others, compared to how much they are satisfied with their lives. It is a sensitive and beautiful article that combines simple charts and animations to tell a data story. In particular, it shows us the power of adding information and complexity to the narrative using a simple day’s timeline.
👩🏿🦯 An AI tool for Accessibility? Yes, please
Humanity using Artificial Intelligence for good things is what we hope for, and that is precisely what AutoVizuA11y (read as “auto visu ally”) is here for. The tool, made by Feedzai, has launched an open-source React library that can be incorporated into digital products to improve accessibility for the visually impaired. The tool aims at improving navigation (using their keyboard), speed of interactions with shortcuts, and better tag descriptions for images and charts. We have yet to test it!
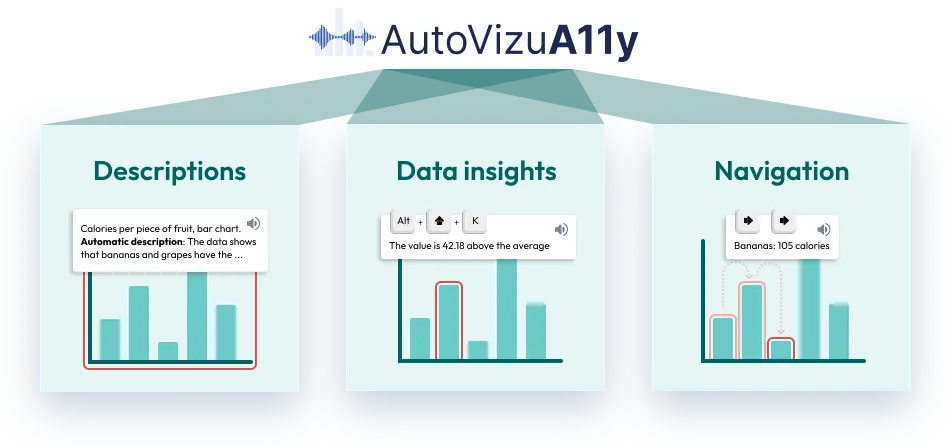
Why is this important? Going through visualizations online takes 200% more time for people with visual impairments than their sighted peers. This is due to bad practices in accessibility. Using AI to do it properly can make the web less horrifying for people with these impairments.
Don’t understand how Generative AI works? Don’t worry; you can now visualize it 👀
GenAI is complex. But Madhumita Murgia and the Data Visualization team from The Financial Times made this very informative scroll-telling to explain how it works. The focus is to show how much Large Language Models (LLMs) have evolved and now can process an entire sentence with transformers, which look at the whole instead of individually analyzing words in a sentence or text. We applaud every effort to improve model explainability. Congrats on the work; we love it!

Want to code but don’t know how to start? Bruno used AI and documented it 💾
Bruno is a designer but wanted to code his entire life. Did he learn how to do it? Not really, but now he has ChatGPT to do it for him. In his new Substack post, learn about his experience interacting with the model to create some cool experiments.

A few other links that spiked our interest:
📈 Our World in Data has updated its AI key insights
📹 AI x Design has an awesome report on AI and Animation.
↗️ The Viz Collective wrote this cool article on how to build great design systems for dashboards.
Enjoy October, whether it is smelling the flowers 💐 or drinking expensive Pumpkin Spice Lattes 🎃!
 | A guest post by
|